Financial-sector clientESG Platform2024
Tracking the Pulse of the Planet
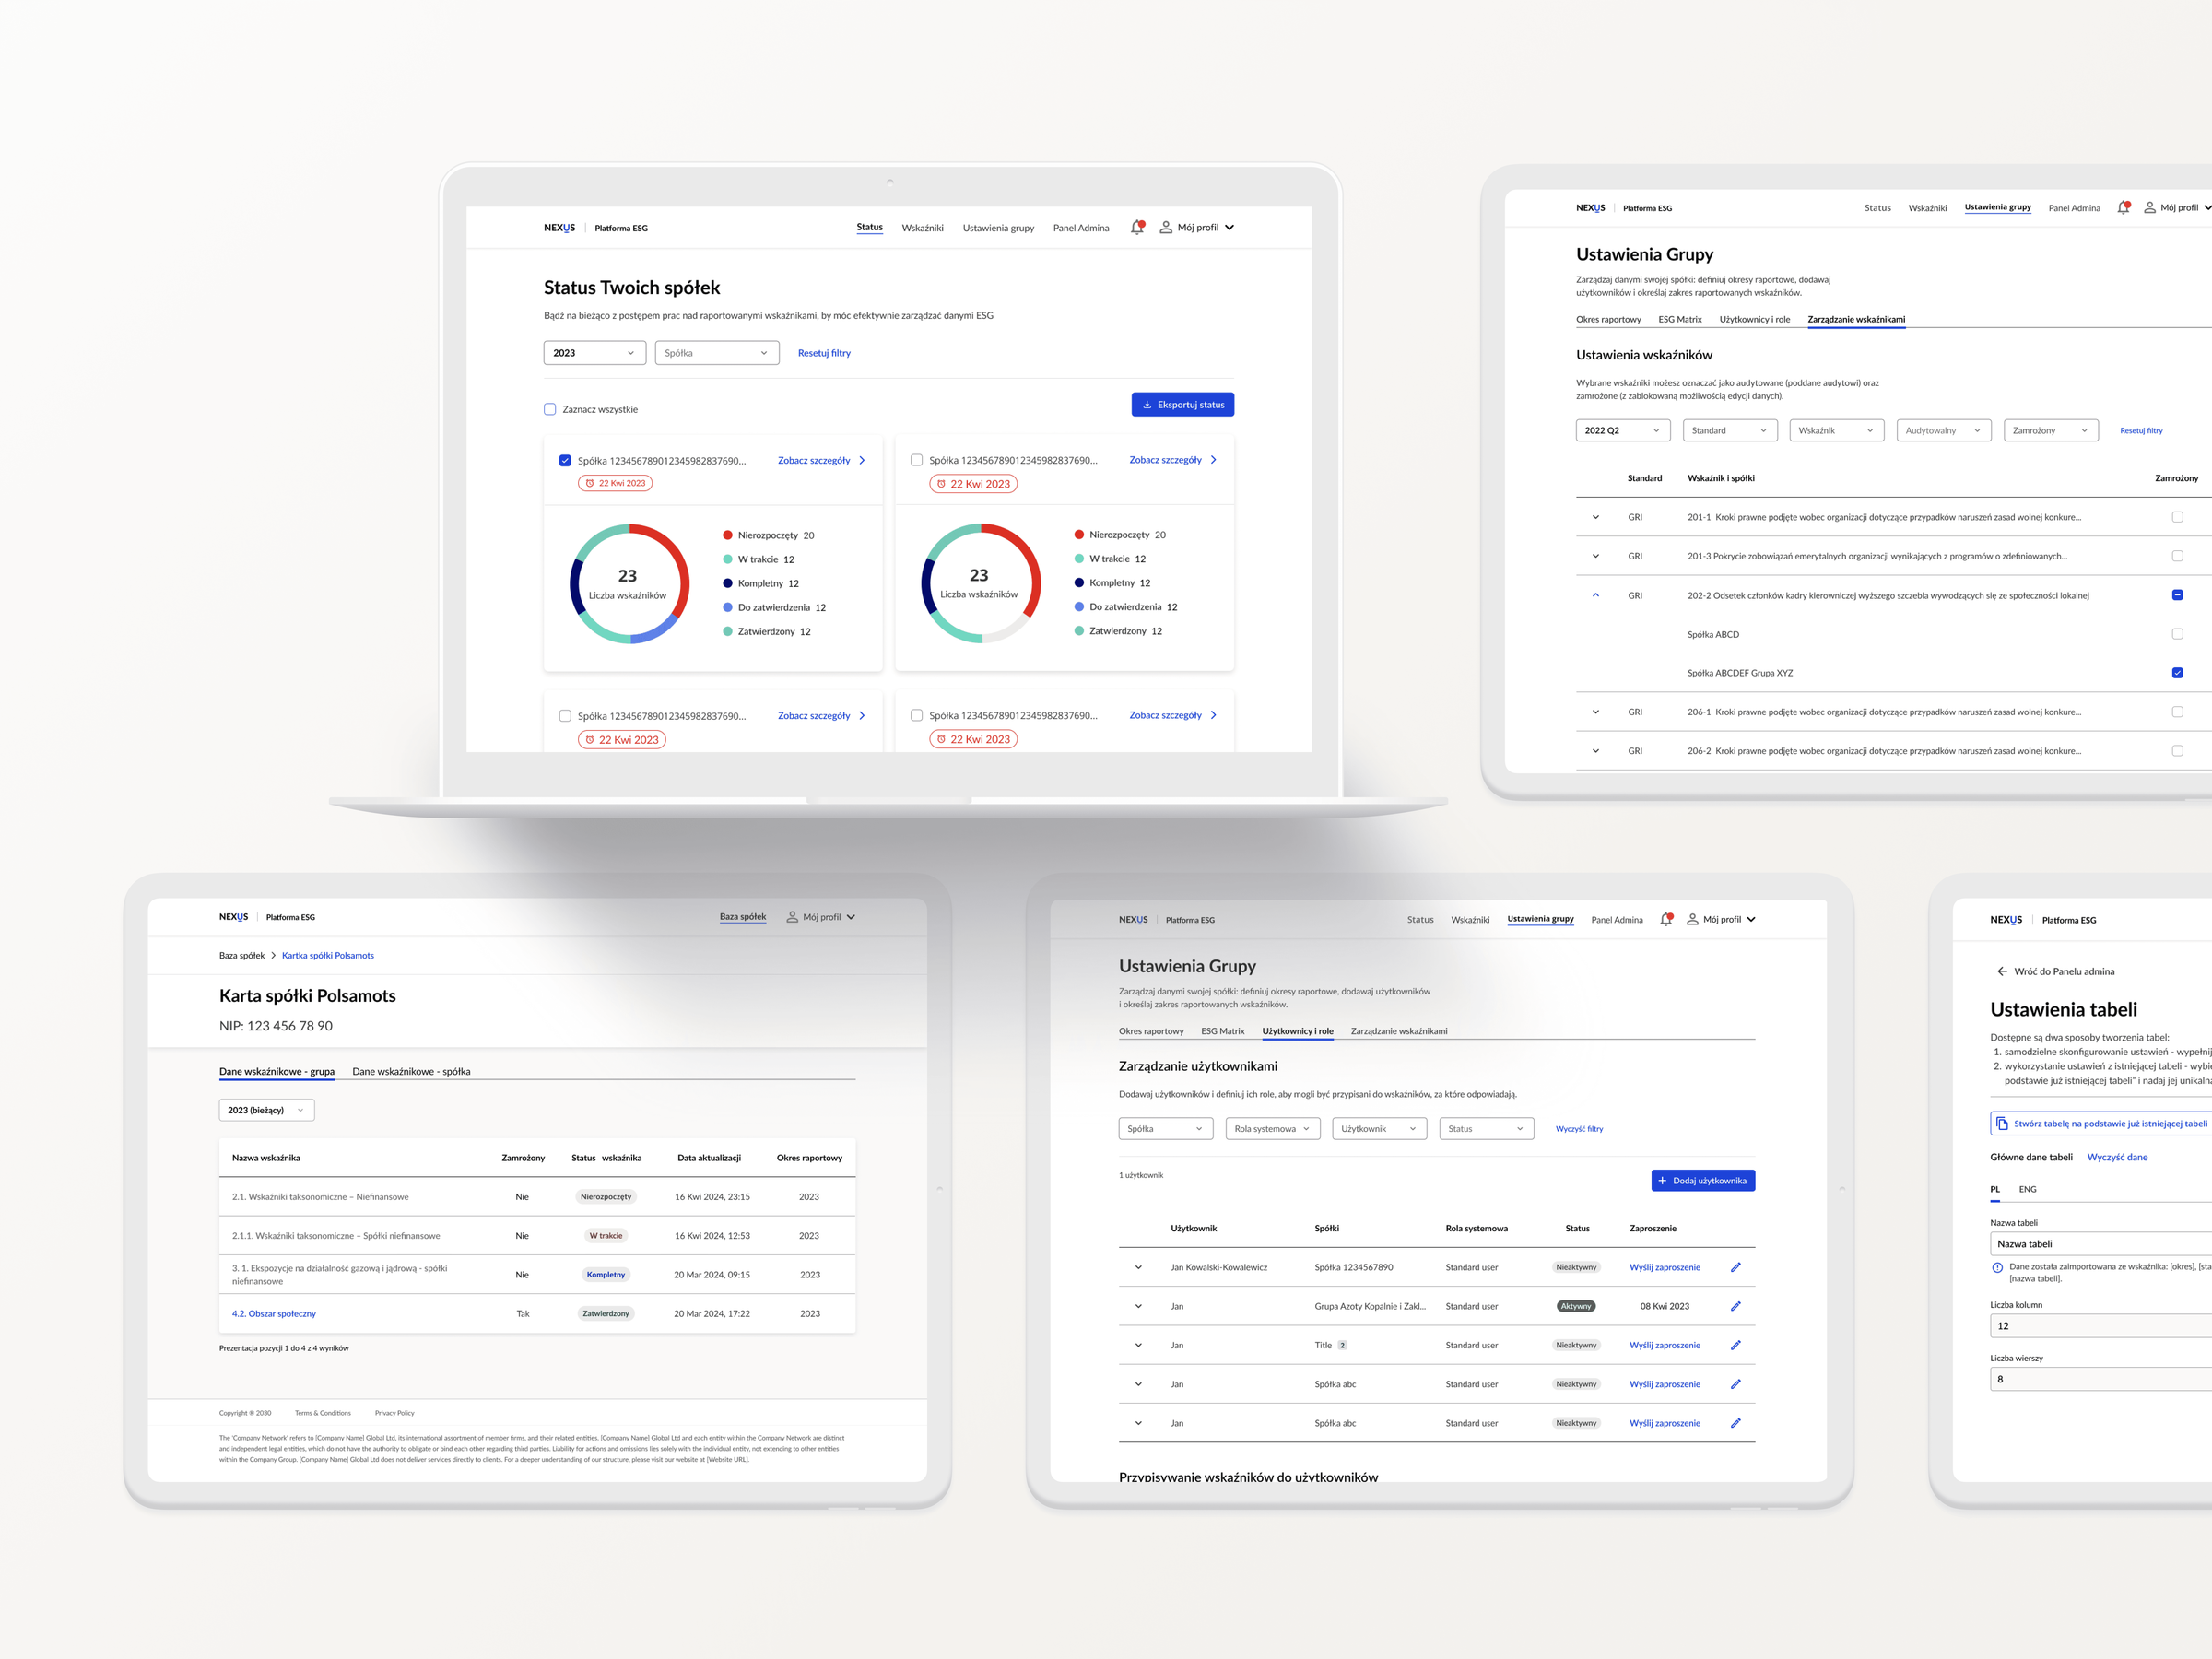
- Timeline
- Feb – Jun 2024
- Role
- UX/UI design — user flows, personas, site maps, visual design, prototyping
- Tools
- Figma, FigJam, Illustrator
TL;DR
The ESG Platform streamlines the reporting, analysis and management of Environmental, Social and Governance data. It lets users input, review and approve complex ESG indicators, customise dashboards and manage investment financing applications.
- financial sector organisations joined since launch
- 17
- entities in the database under qualitative review
- 165
Discovery
Three user types, one connected platform
The ESG platform supports three distinct user types: administrators, company representatives and bank employees. Each role interacts with complex data that must be managed and analysed effectively. The user flows are also interconnected: actions taken by one user type can directly affect the experience and workflow of the others.
Admin
Manages user access and roles within the platform, creates indicators for companies to report on and assigns specific users to oversee those indicators.
Company representative
Completes forms and reports on finalised indicators.
Bank manager
Oversees the status of indicators assigned to companies, ensuring compliance and determining eligibility for investment financing.
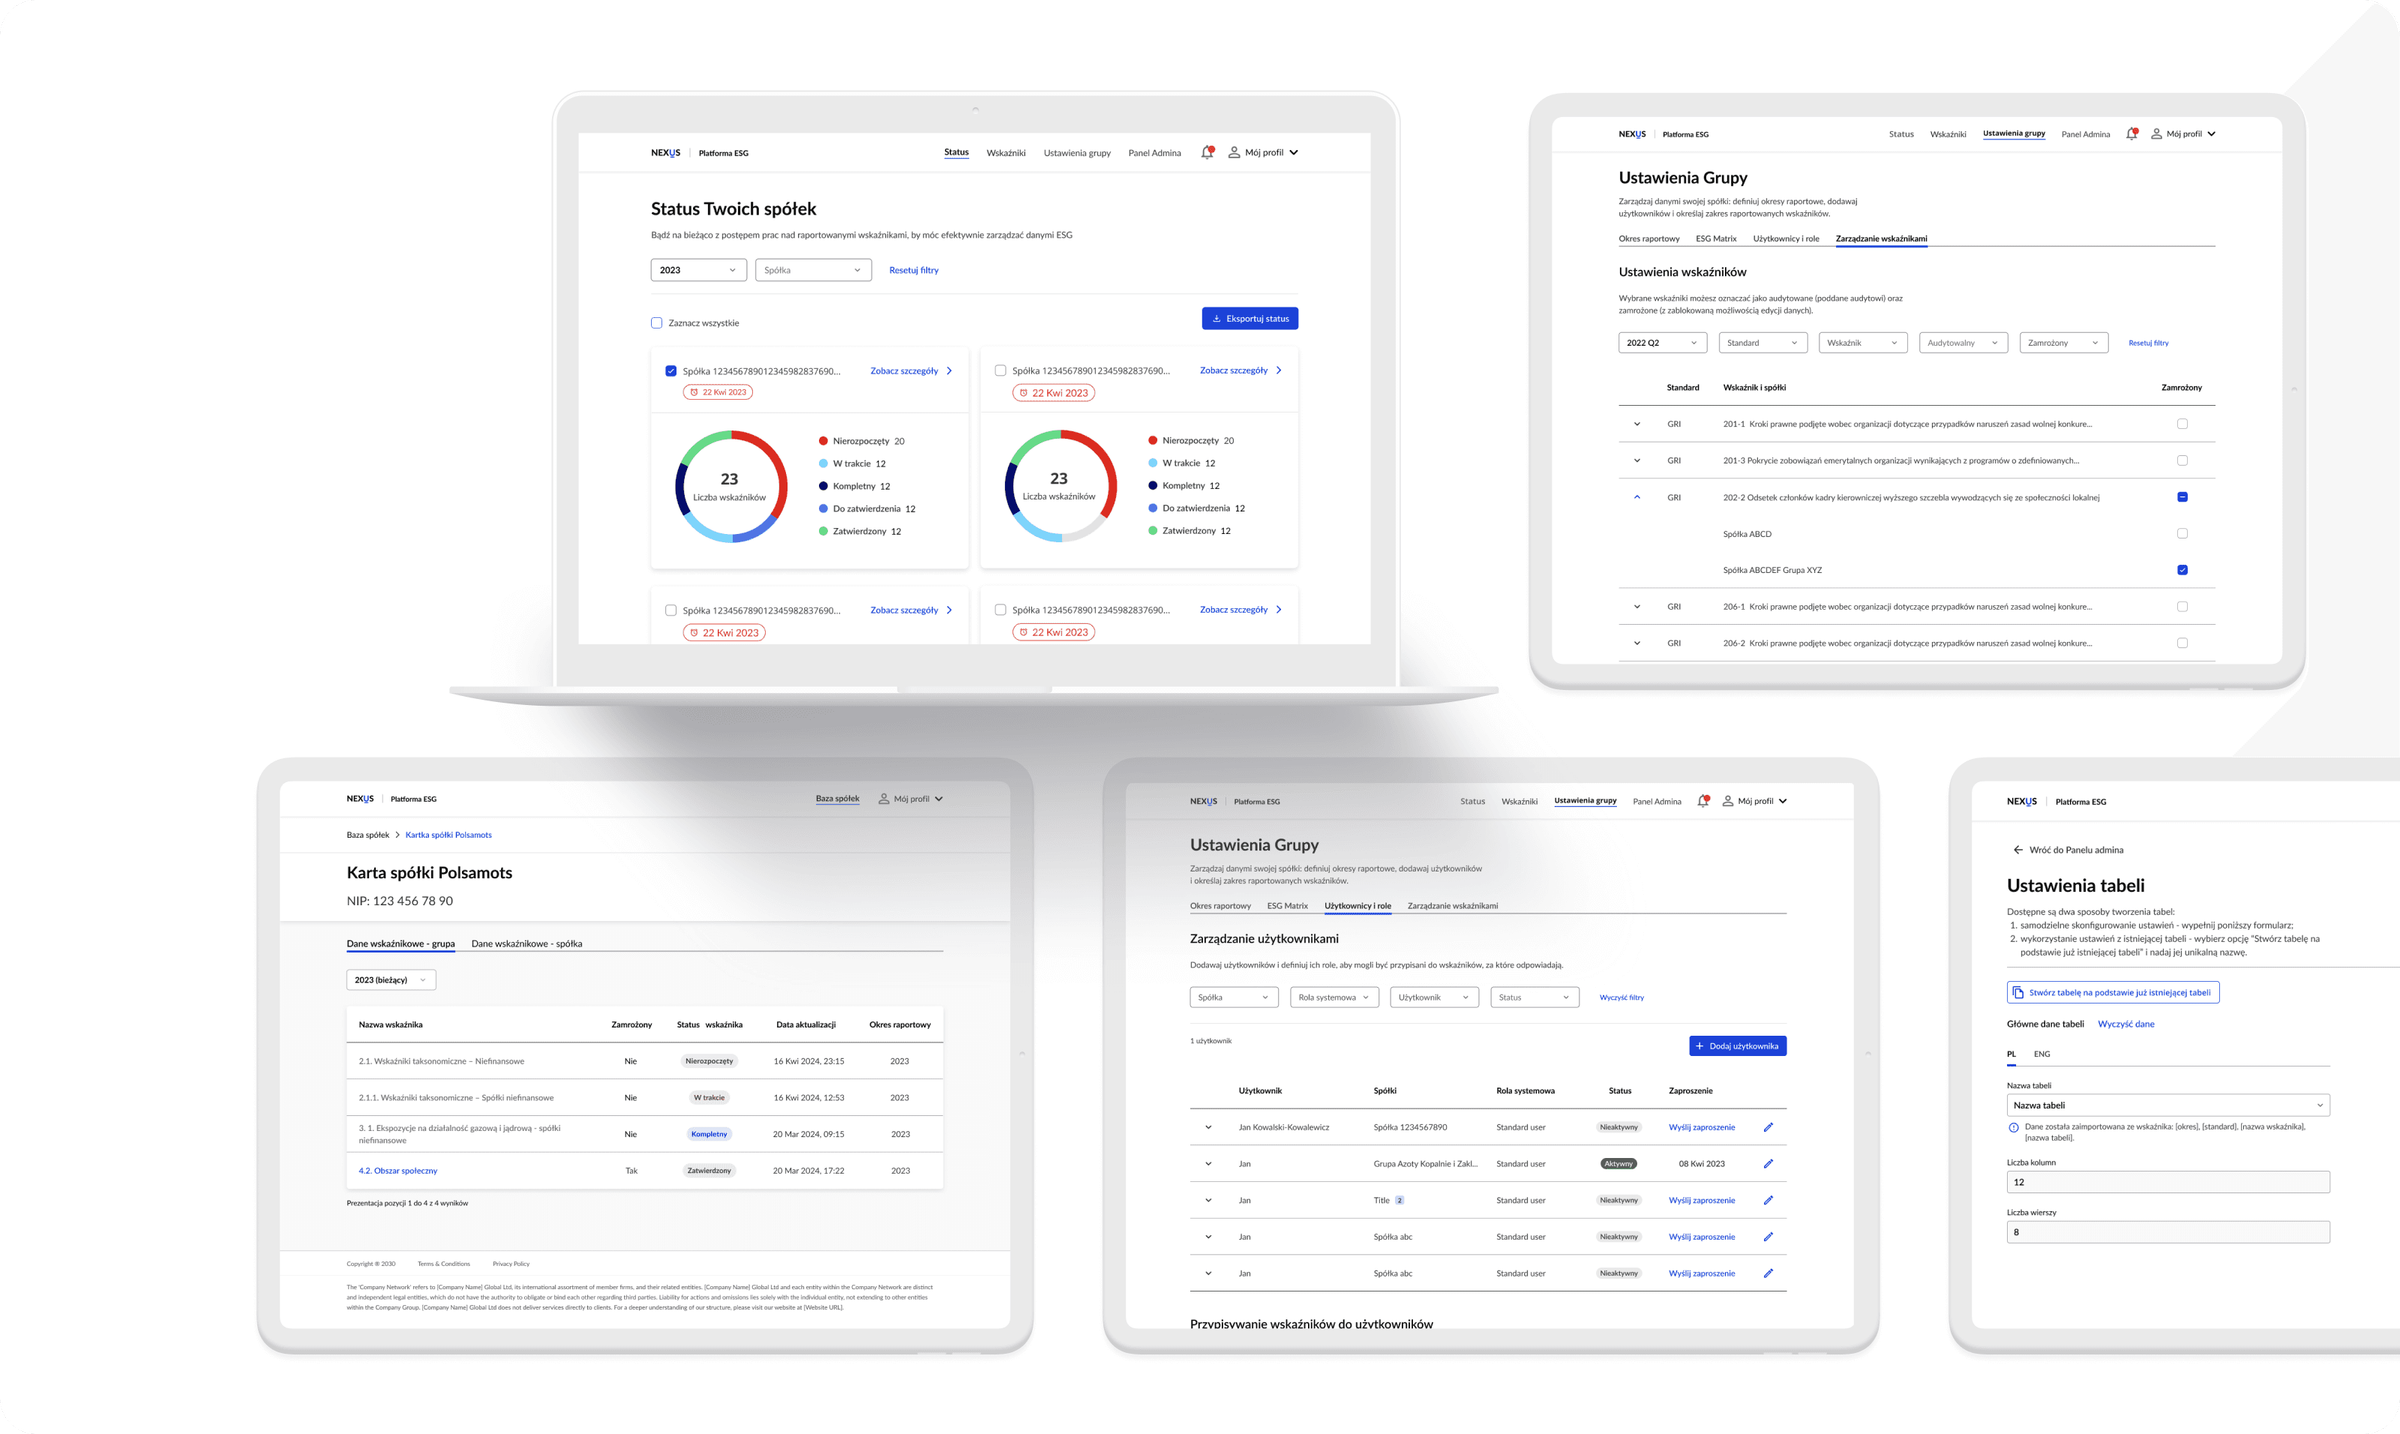
Solution
Simplifying complex workflows
To organise compound flows and meet different user needs, I created an information architecture to ensure a positive user experience.

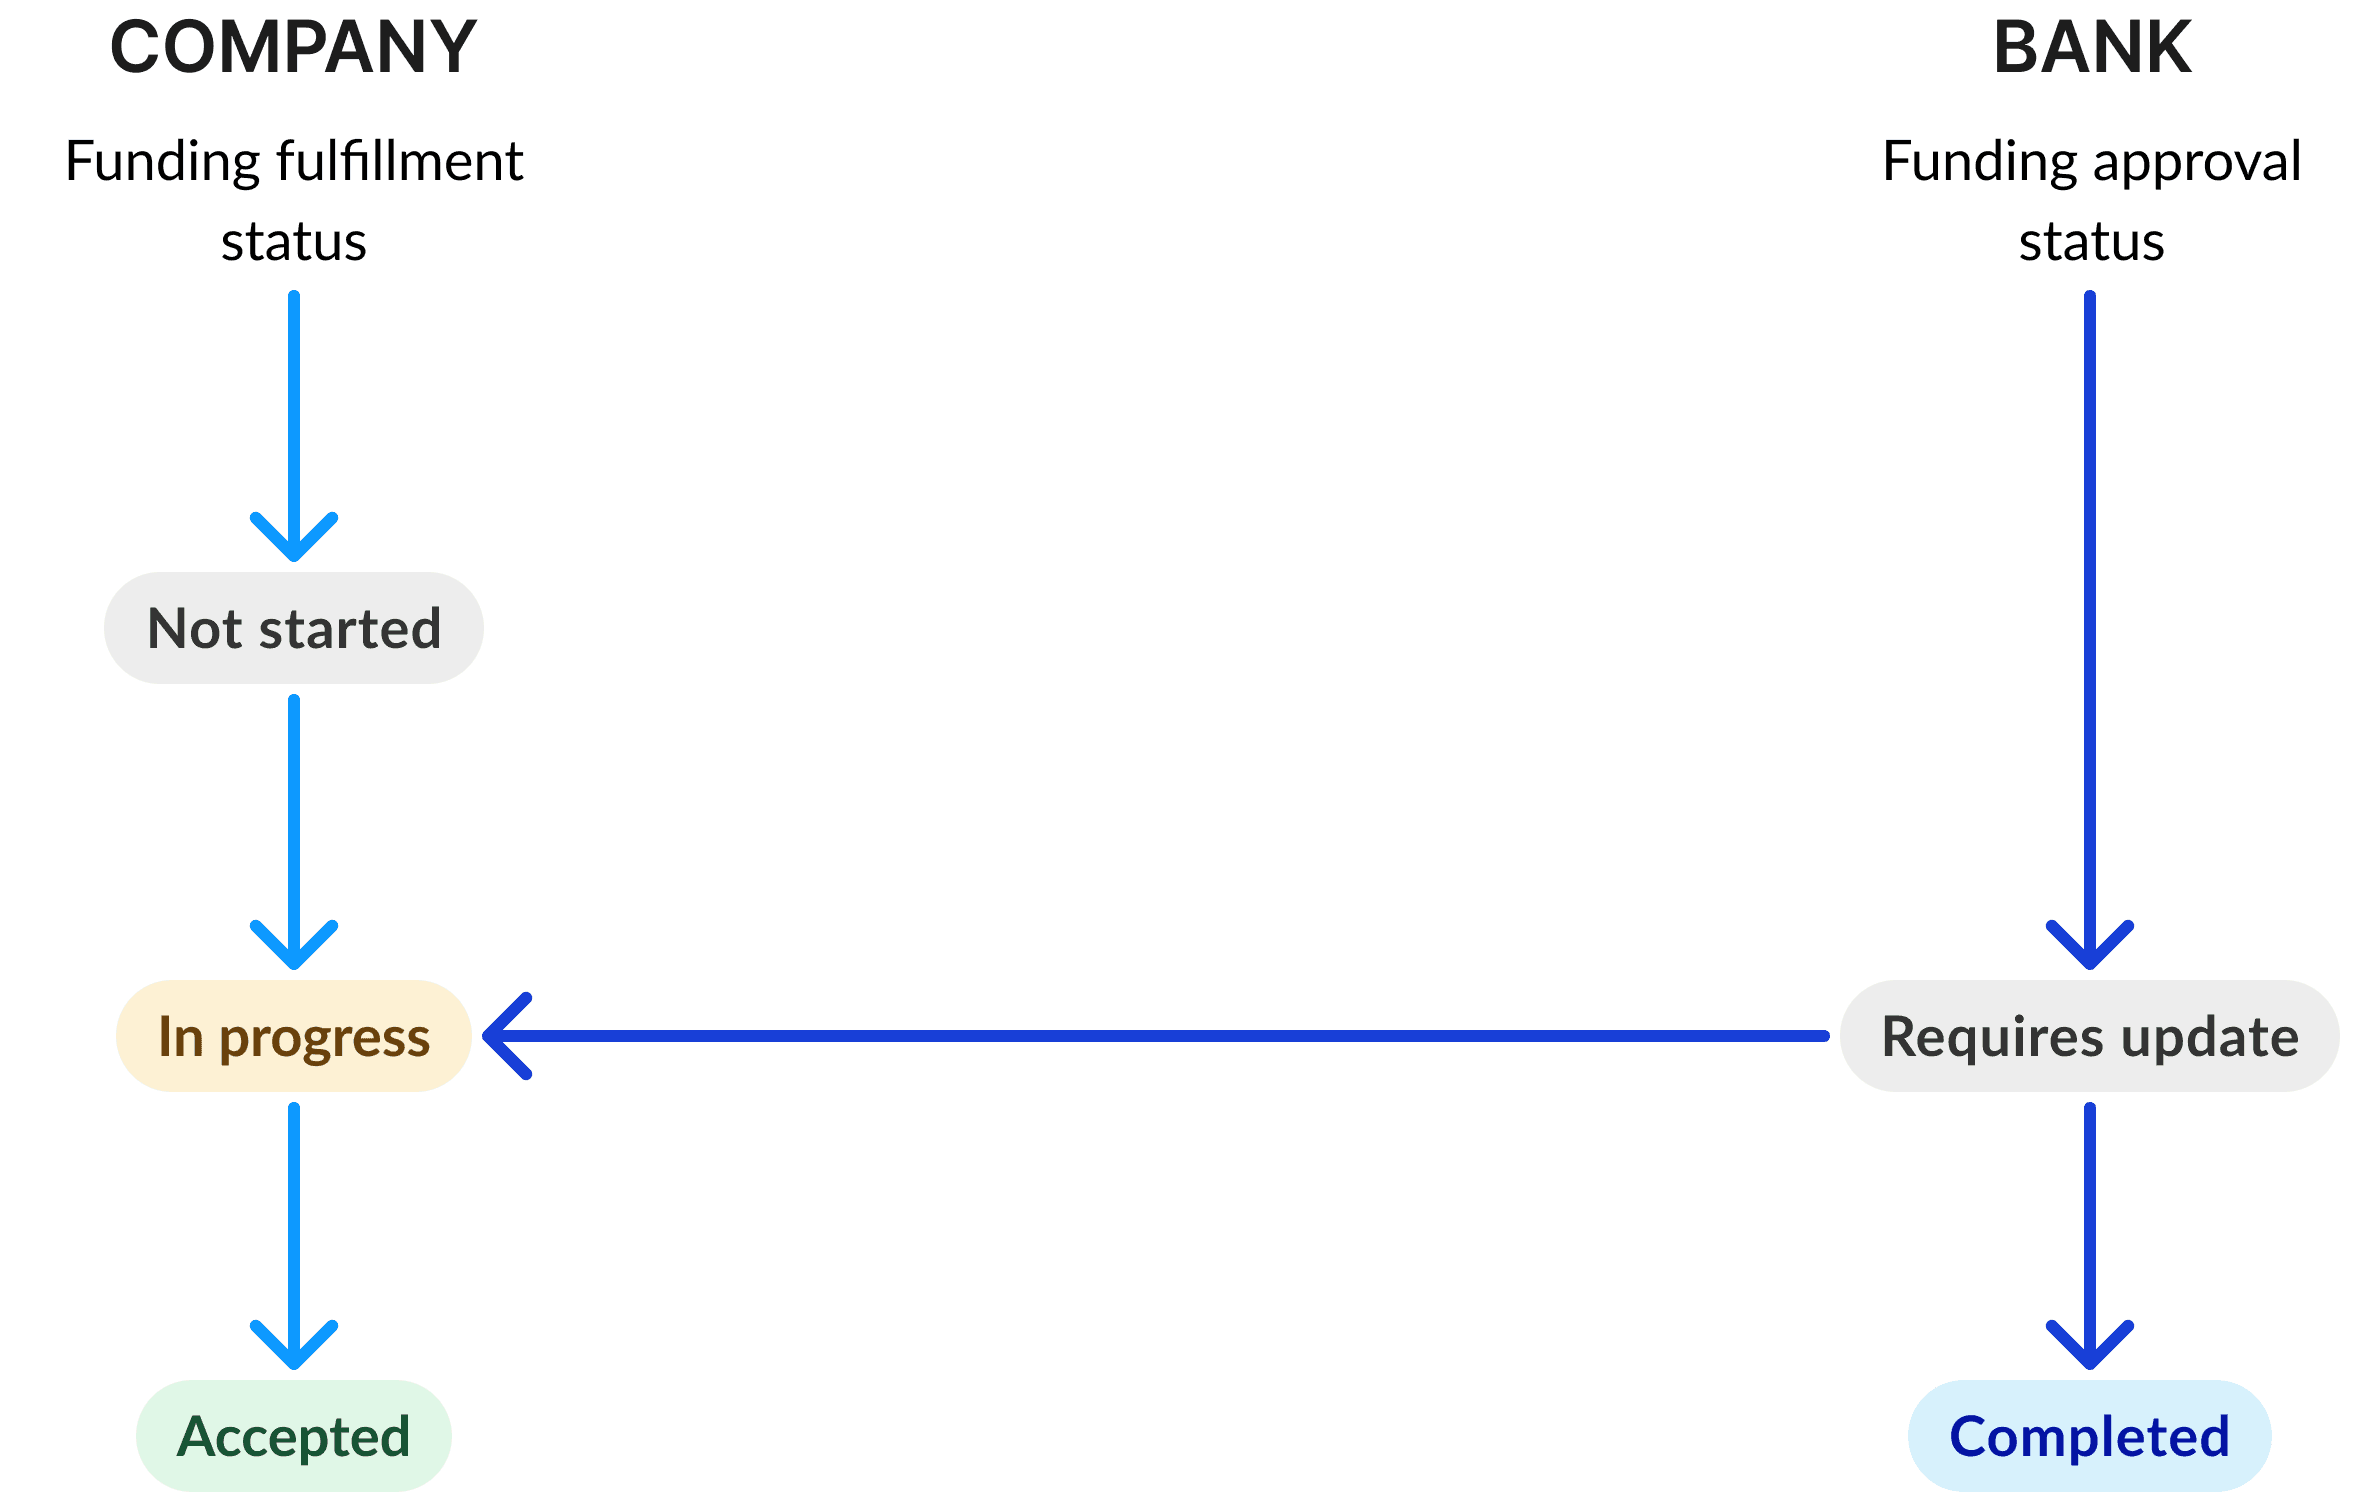
Make information understandable
Clear and consistent labels are crucial for users to understand what each status means and how it relates to the actions they need to take.
Tackling rapid client feedback
Keeping the design file organised was essential in a fast-paced, iterative environment with frequent client feedback.

Redesign
Crafting intuitive solutions
1 / 3 · A clear starting point
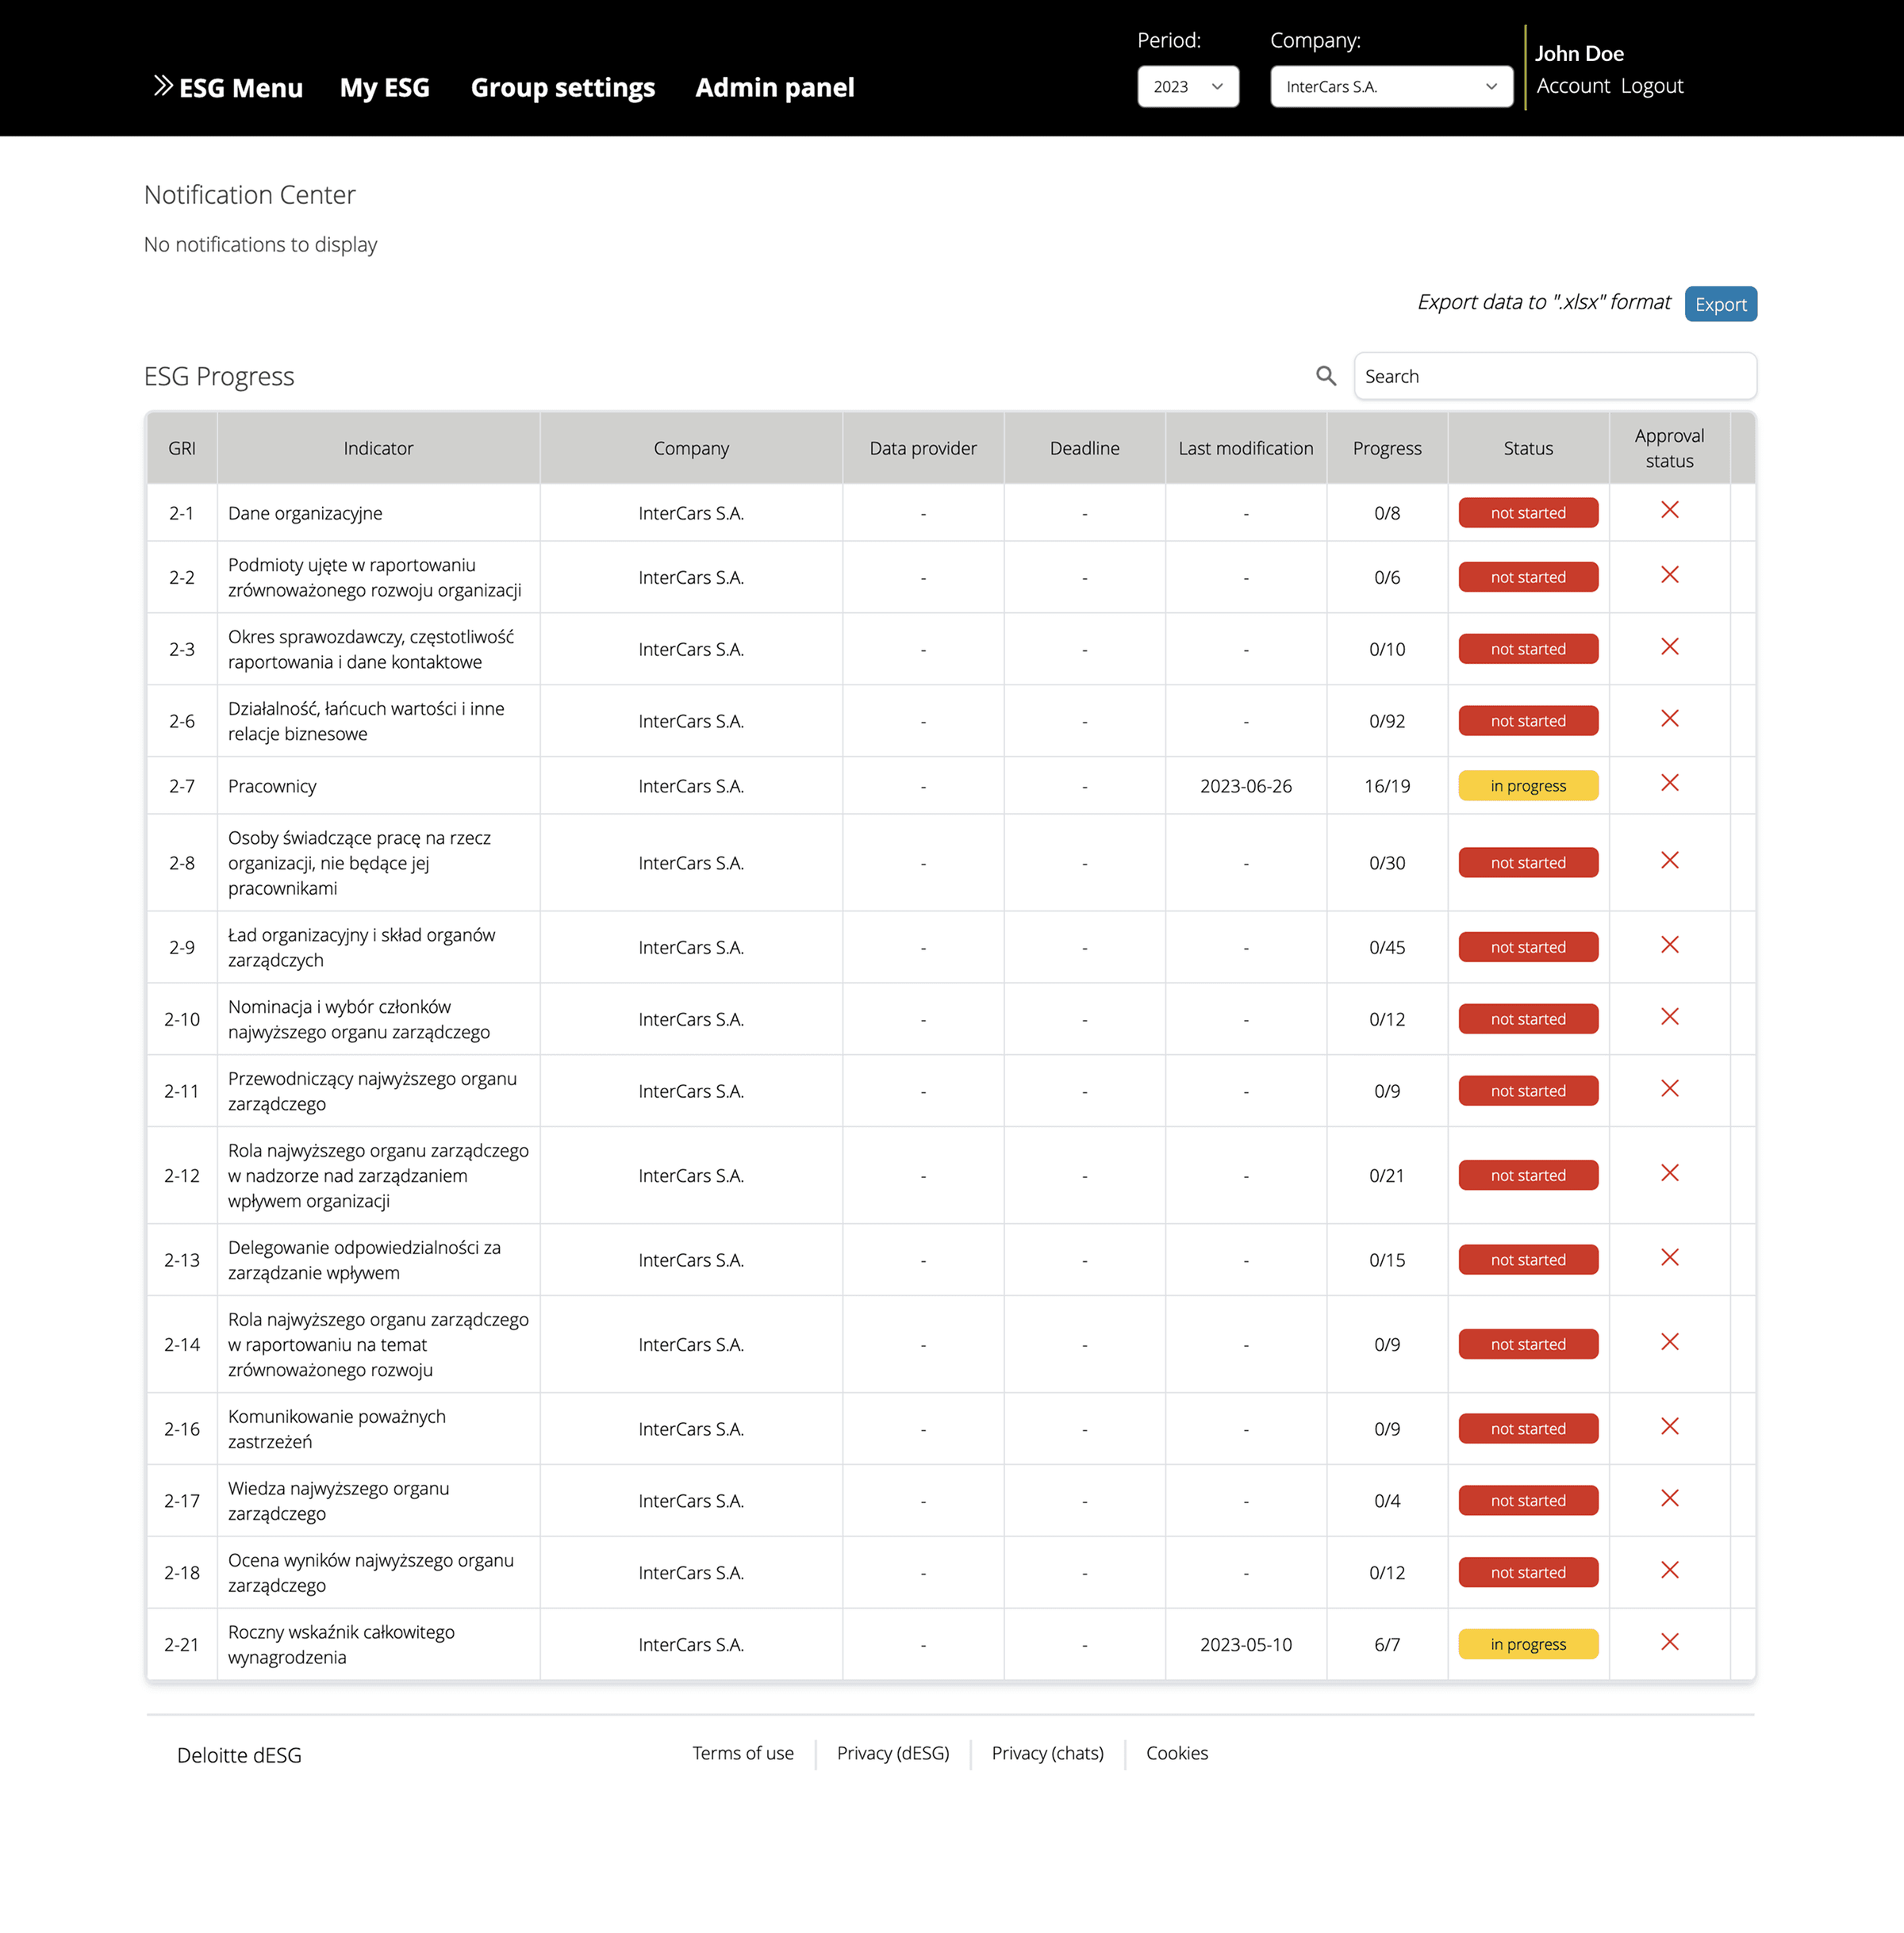
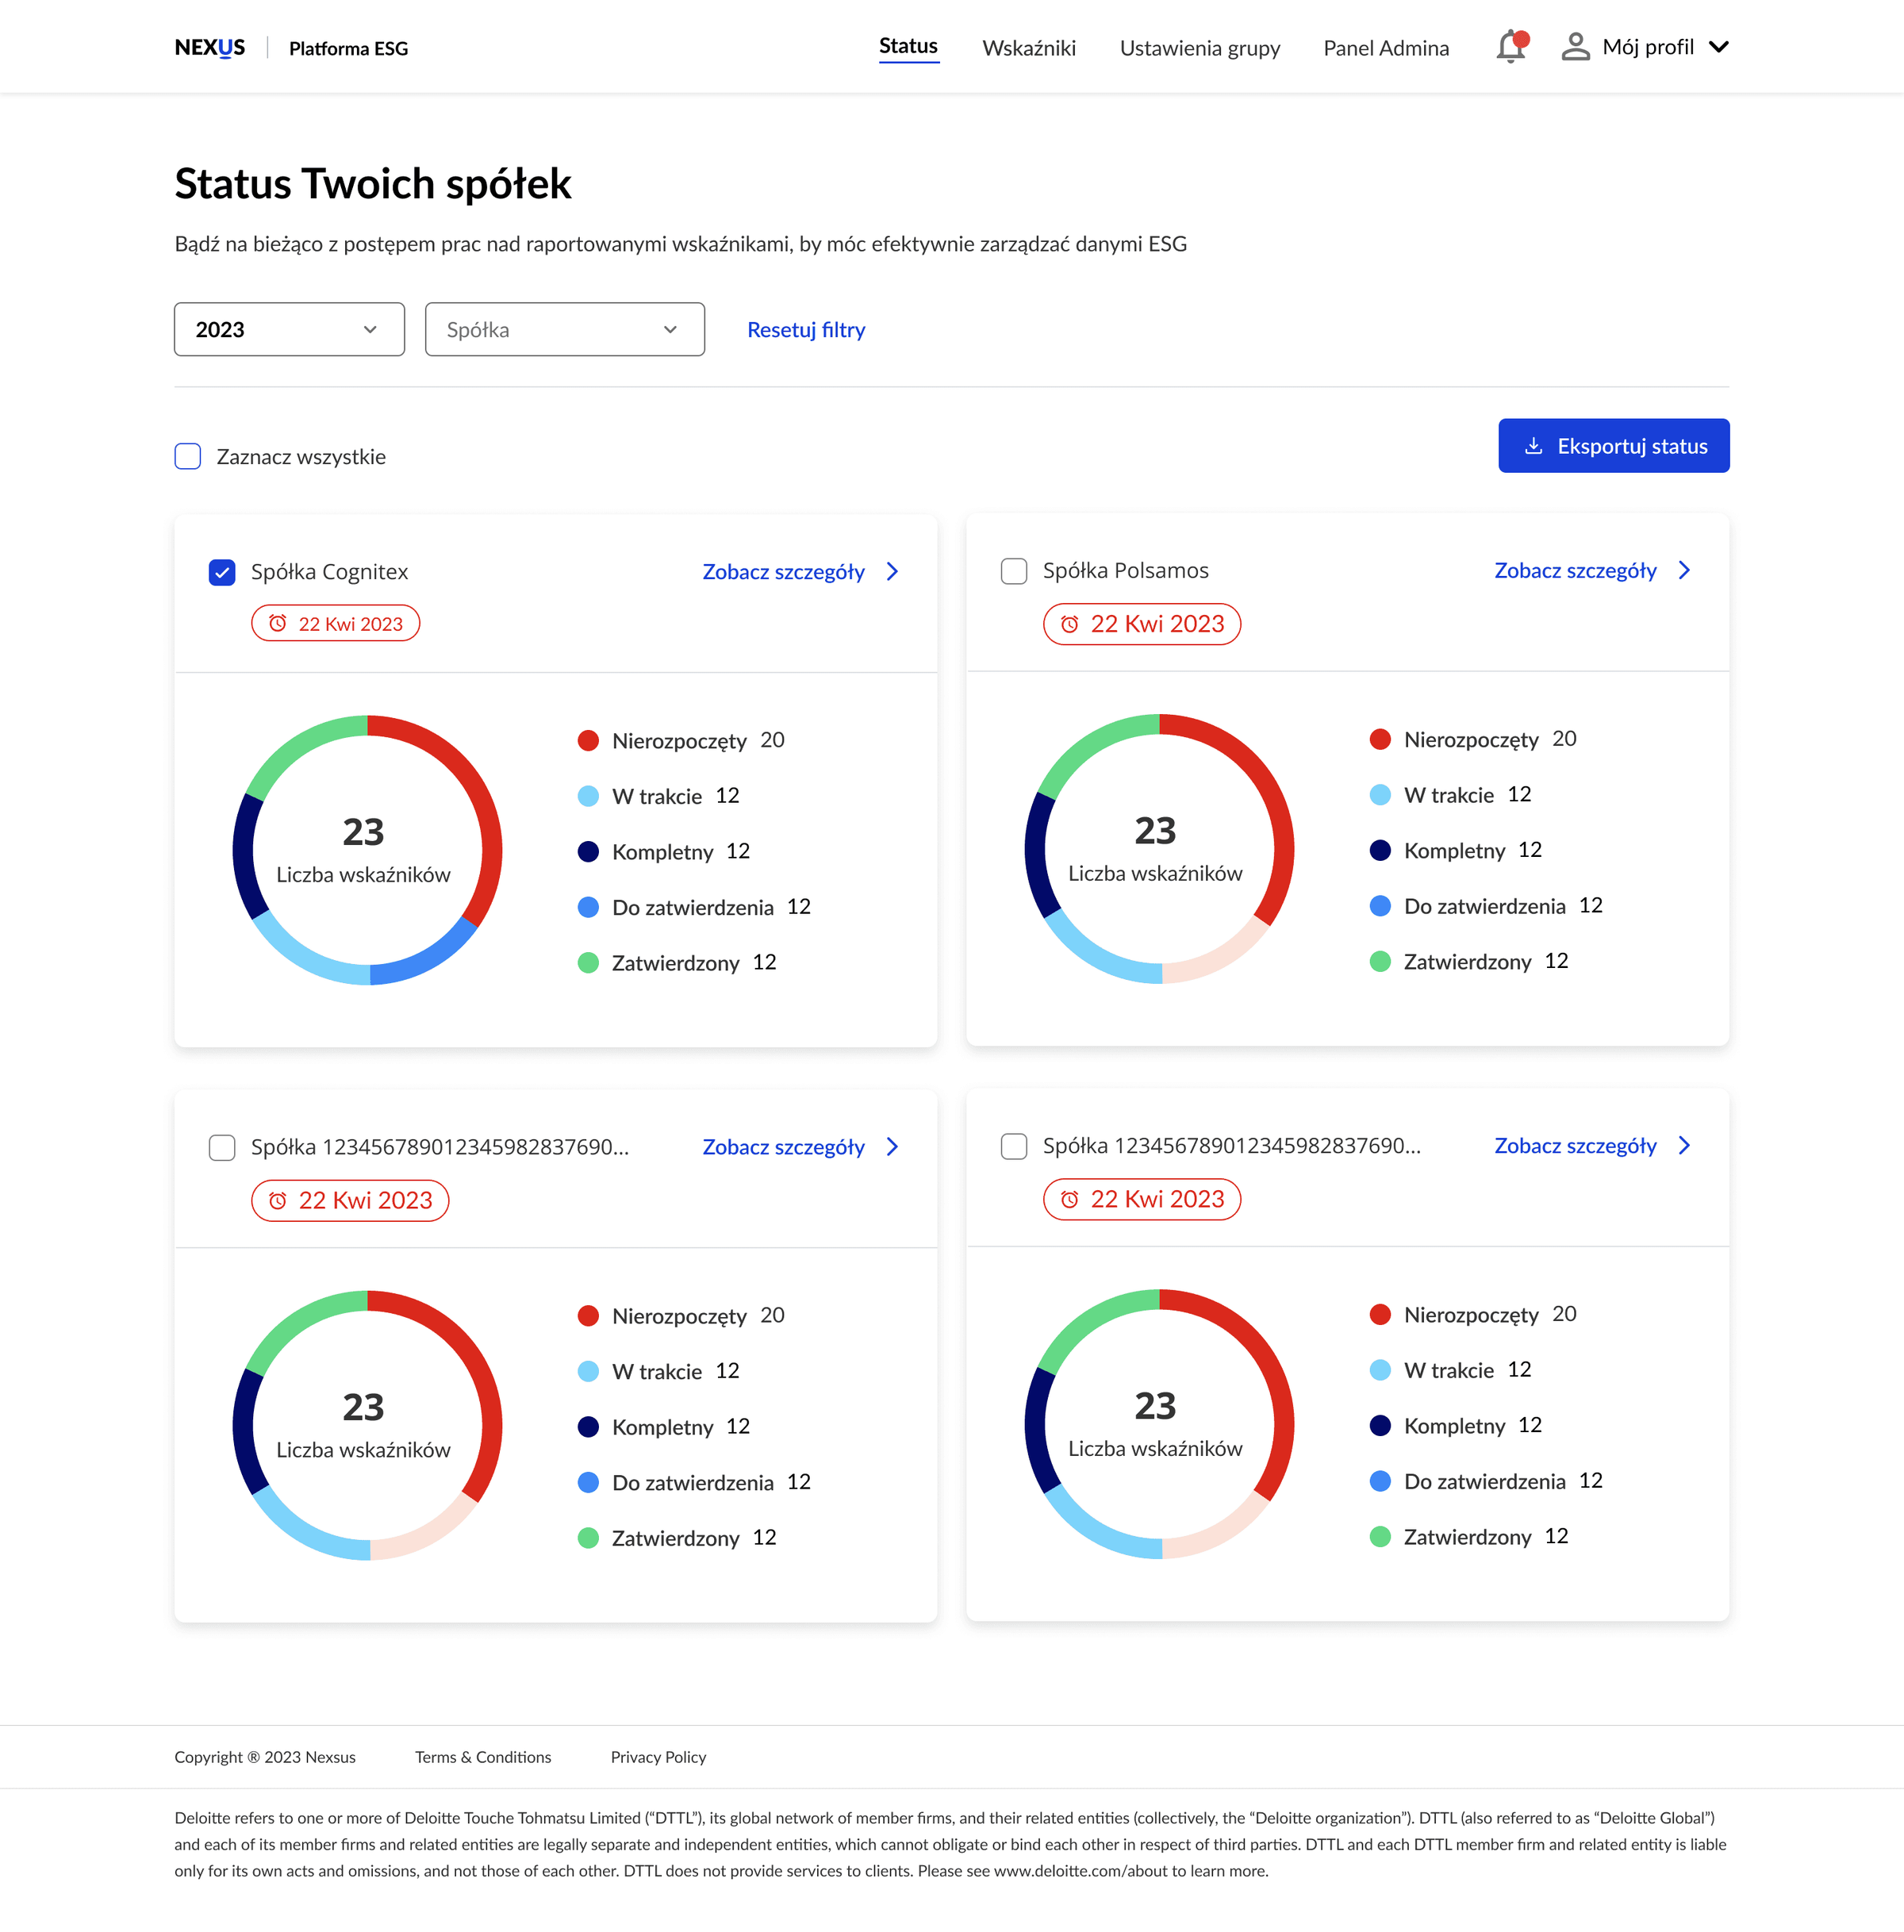
Users entered the platform only to be met with an overwhelming table of complex data: difficult to navigate and even harder to analyse. There was no clear starting point, no indication of where they had left off, and no guidance on which indicators needed attention first.
To address this, I designed a dashboard that presents the statuses and deadlines of all indicators assigned to the companies the user manages, in a clear and intuitive way.
2 / 3 · Focus on approval
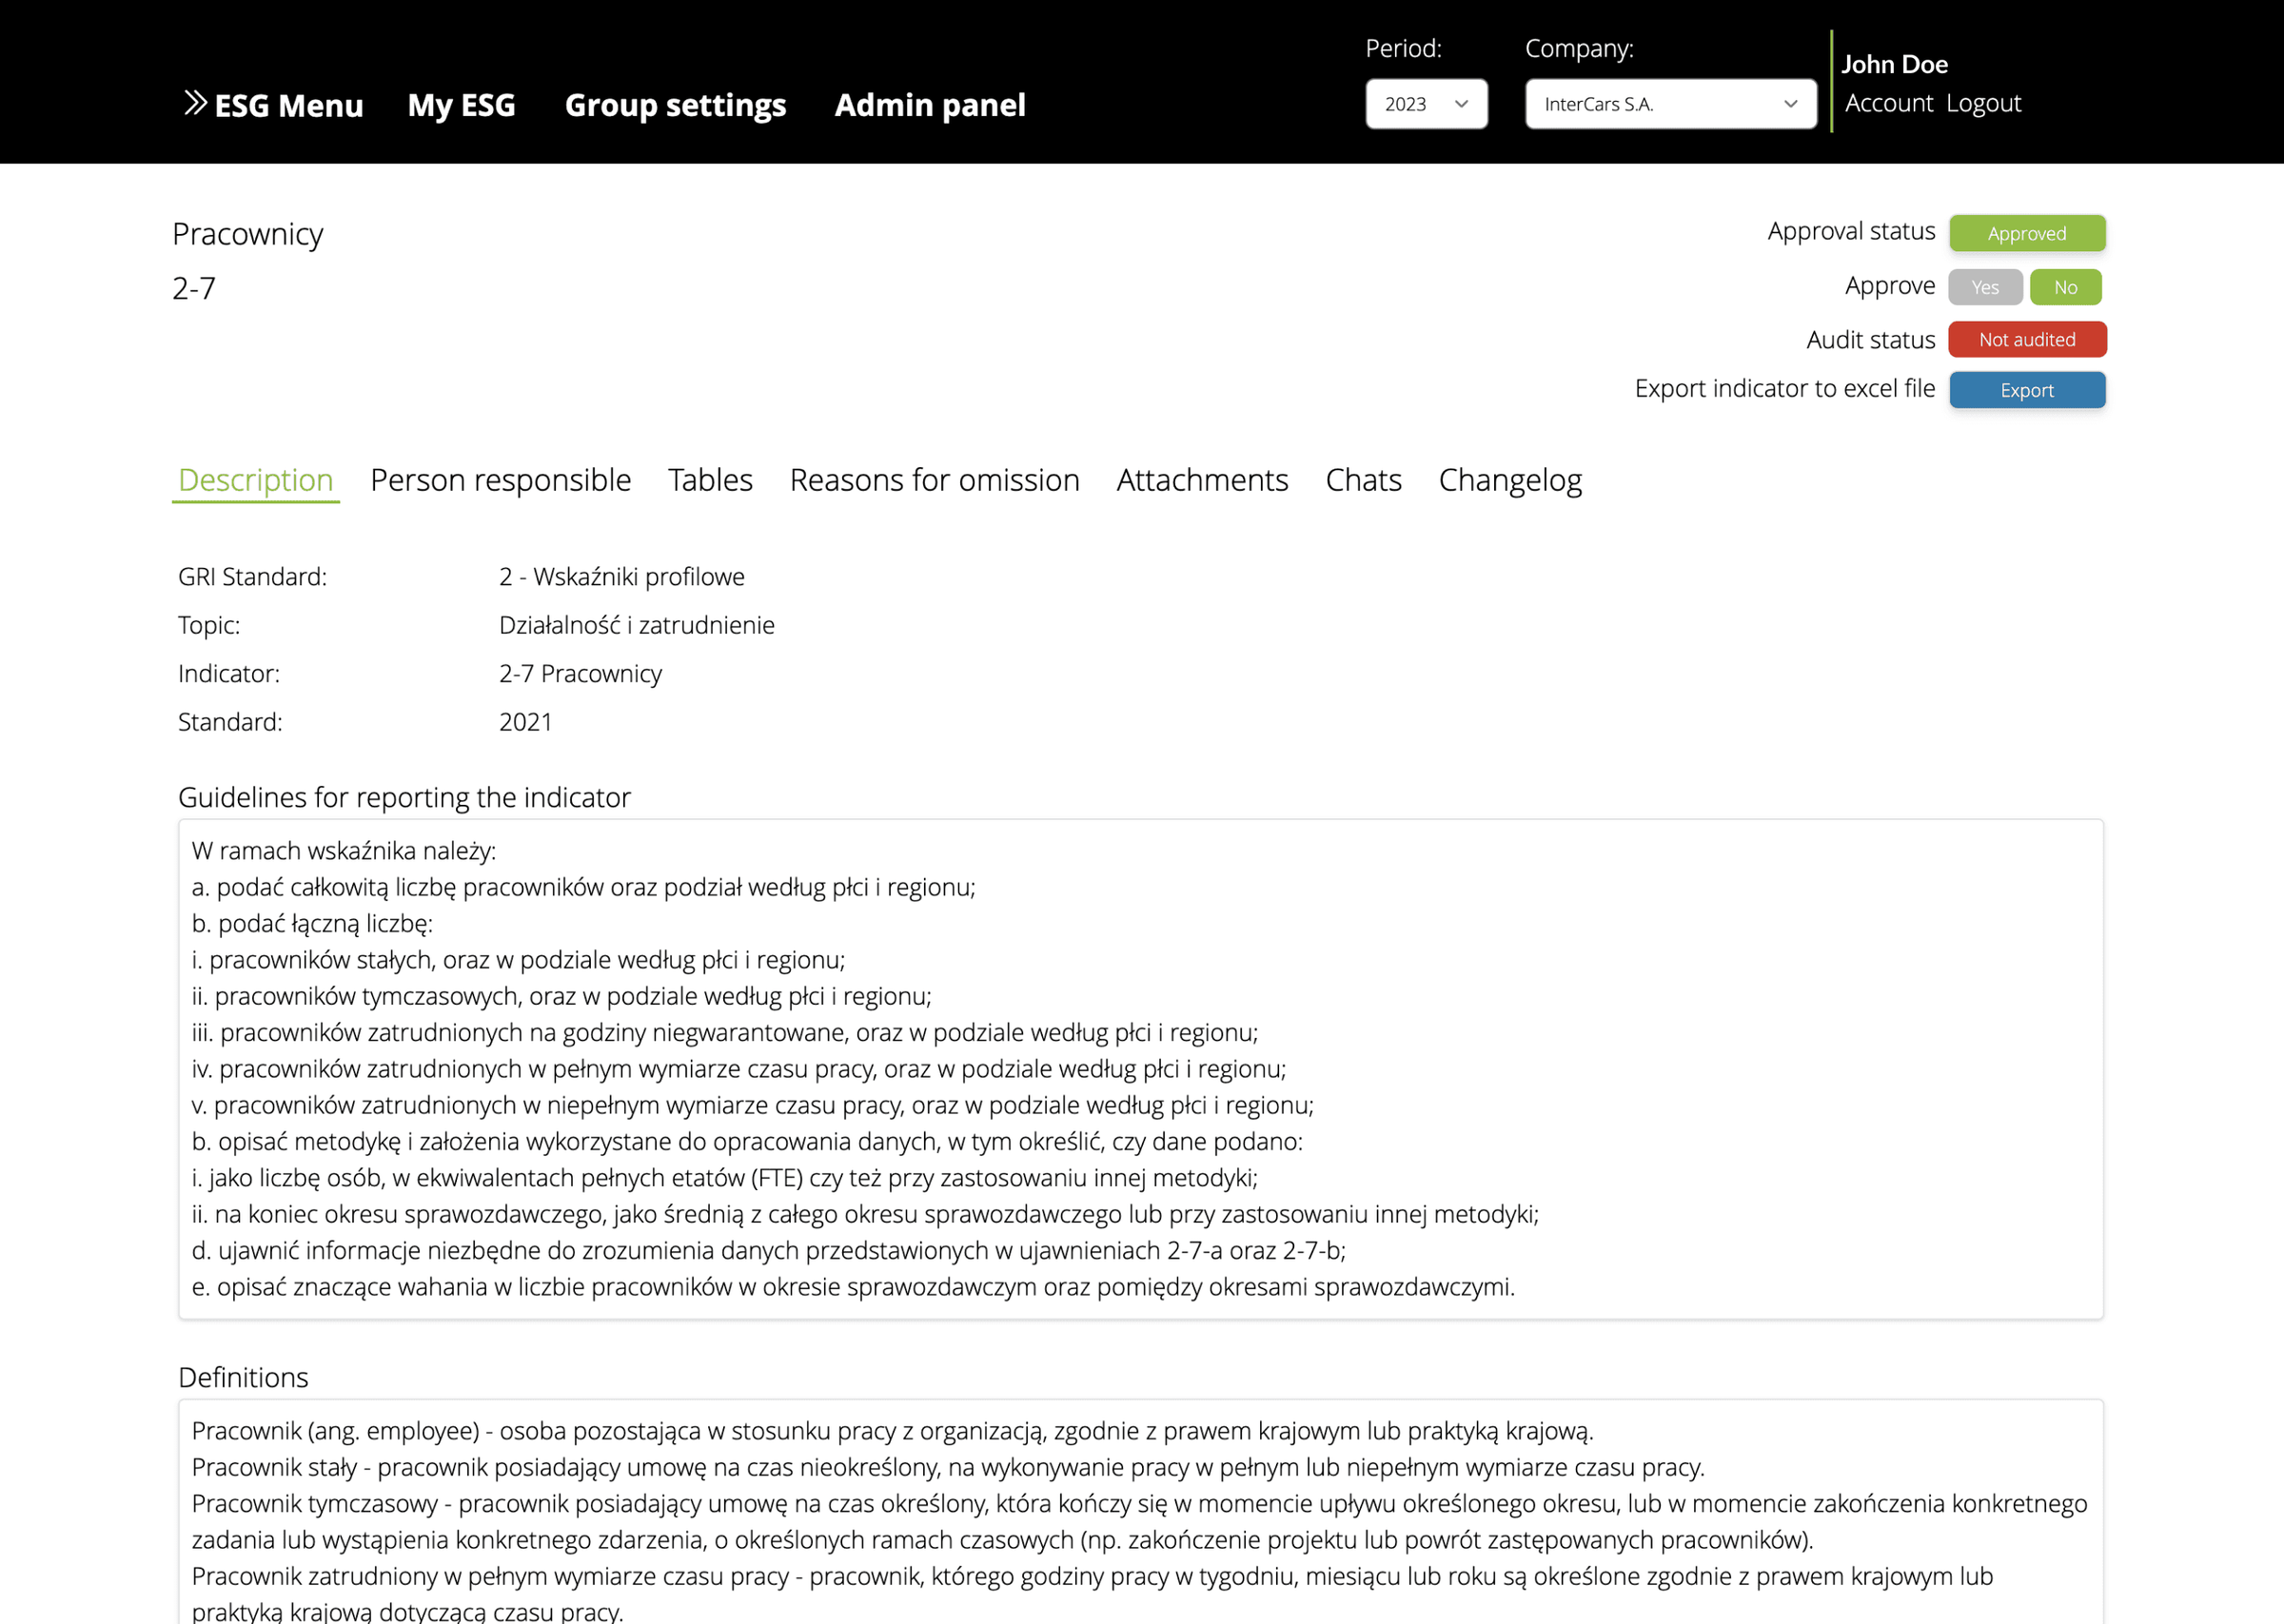
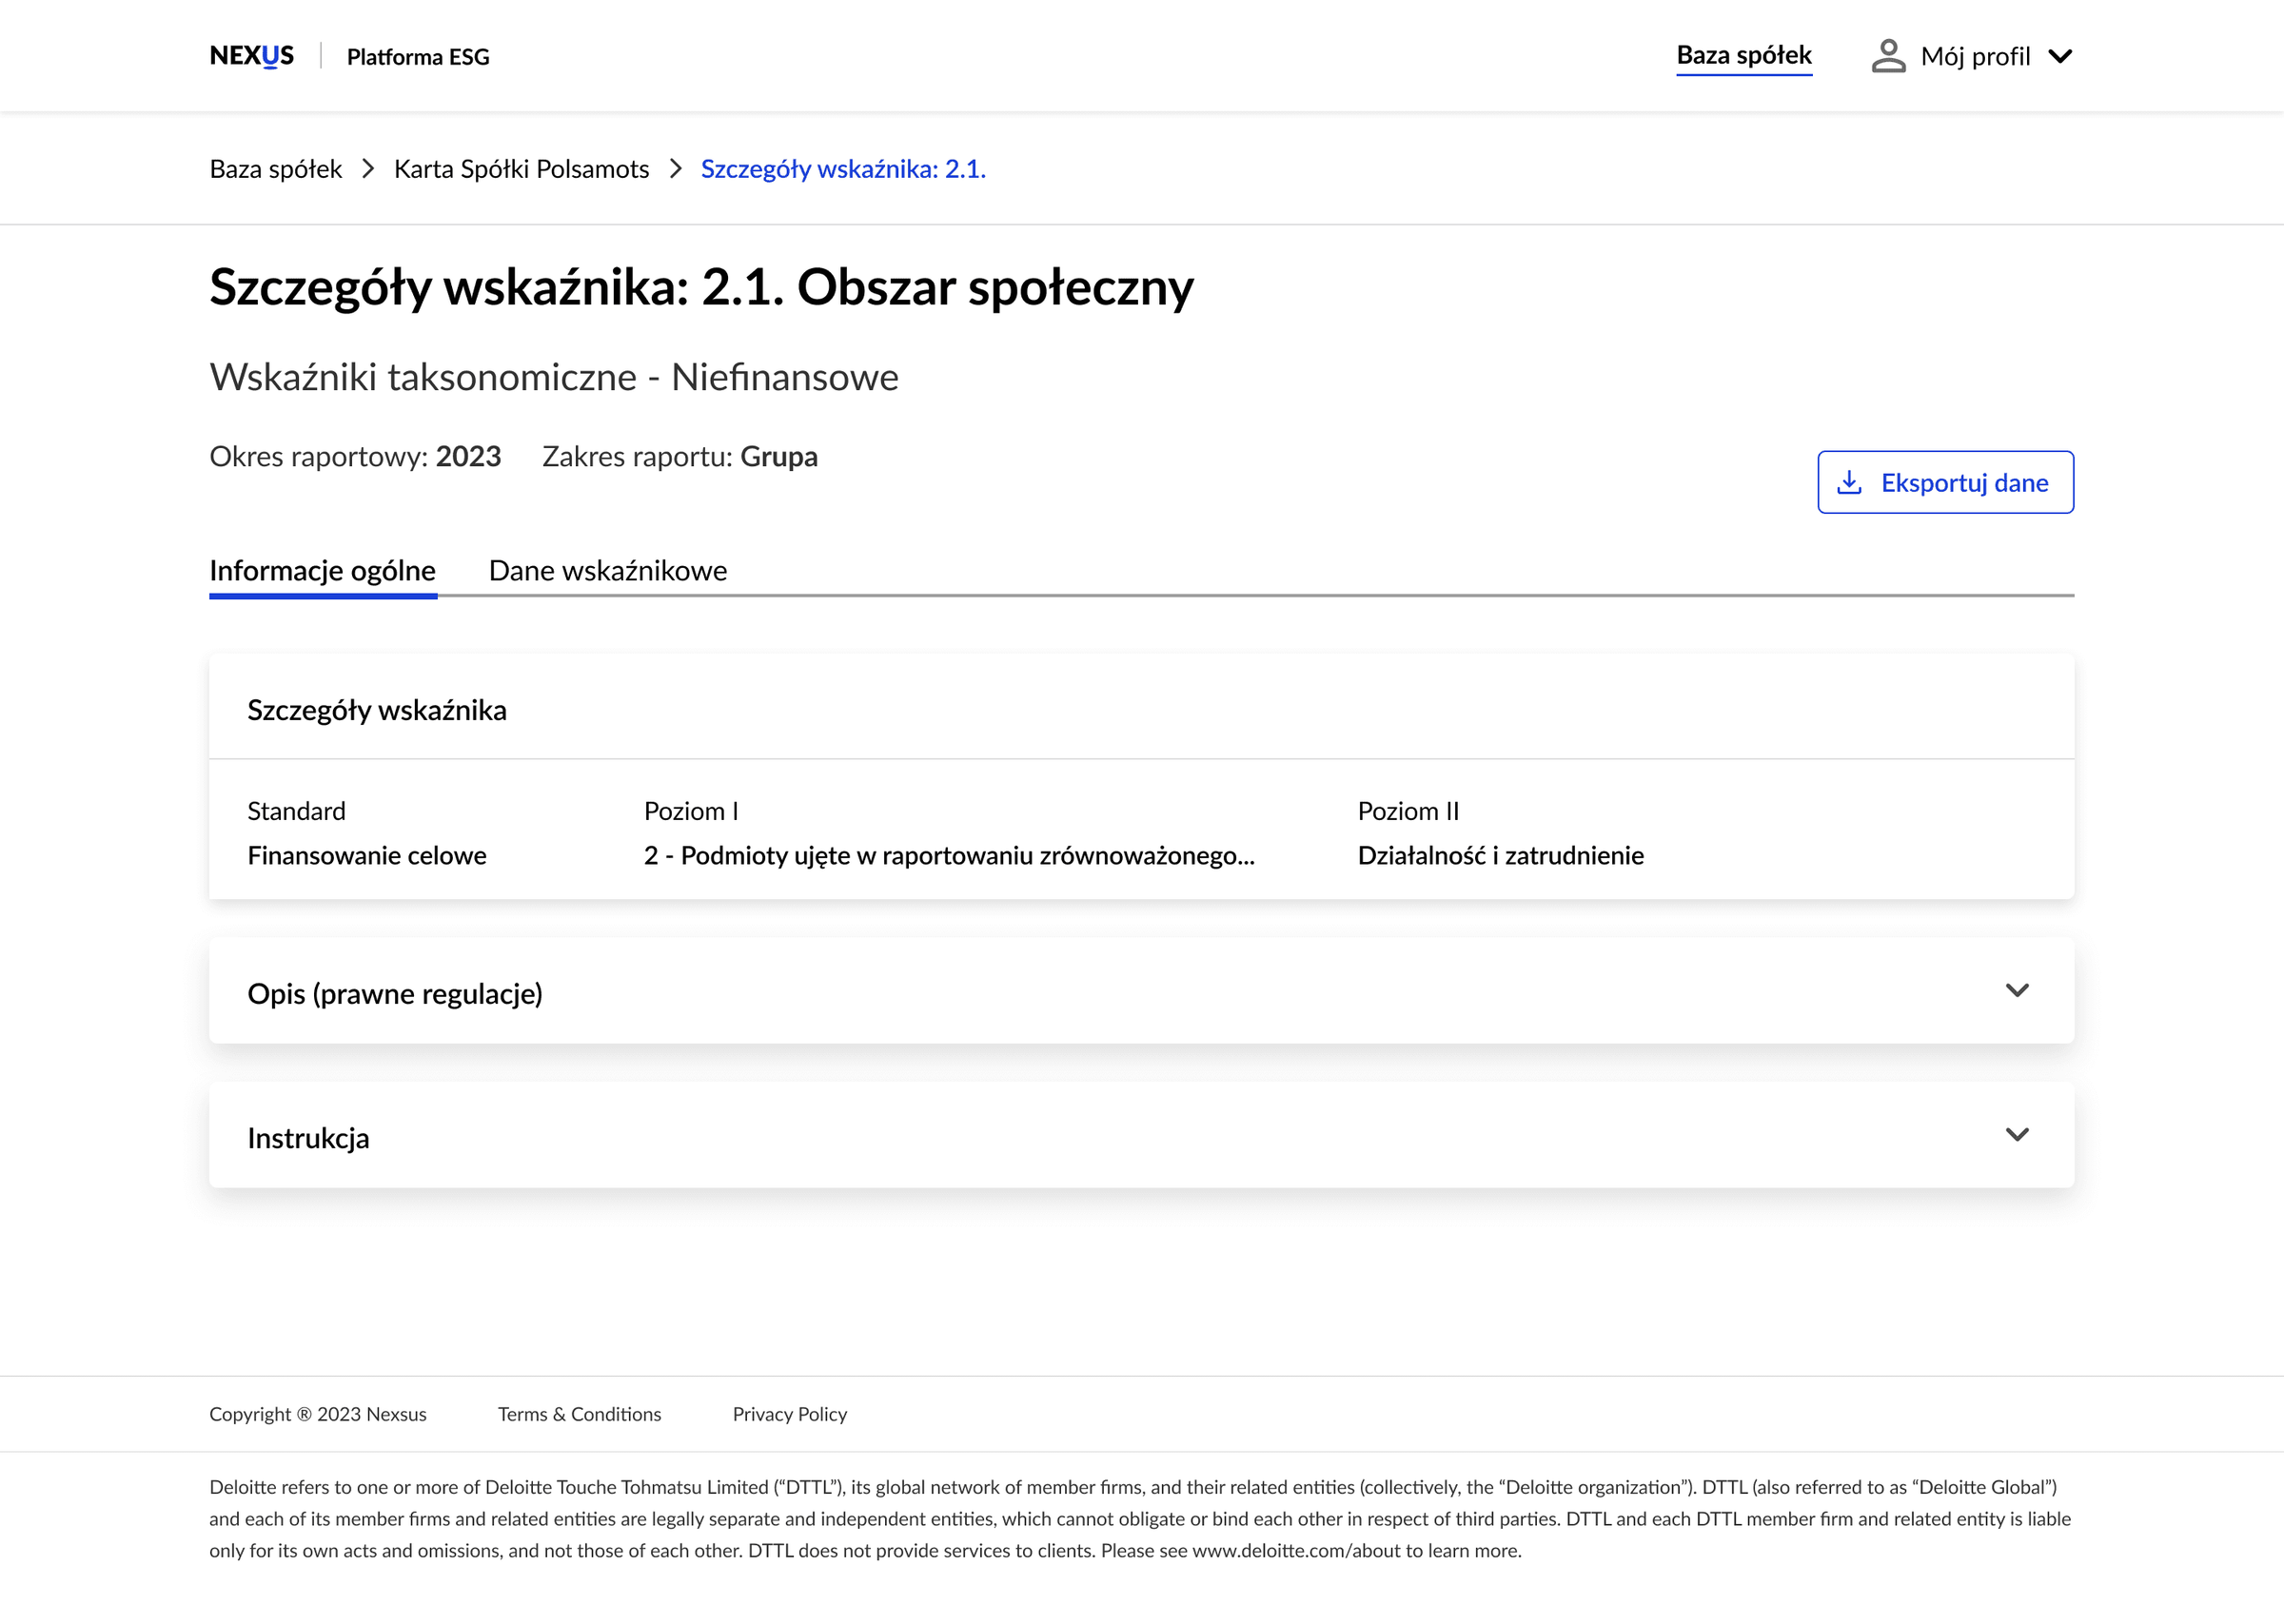
On the individual indicator page, the volume of data made it difficult for bank employees to focus on their main task: approving that an indicator was complete. To address this, I reduced the number of navigation items (relocating some based on the platform’s architecture) and reorganised the key data to streamline verification.
3 / 3 · Easier assignment
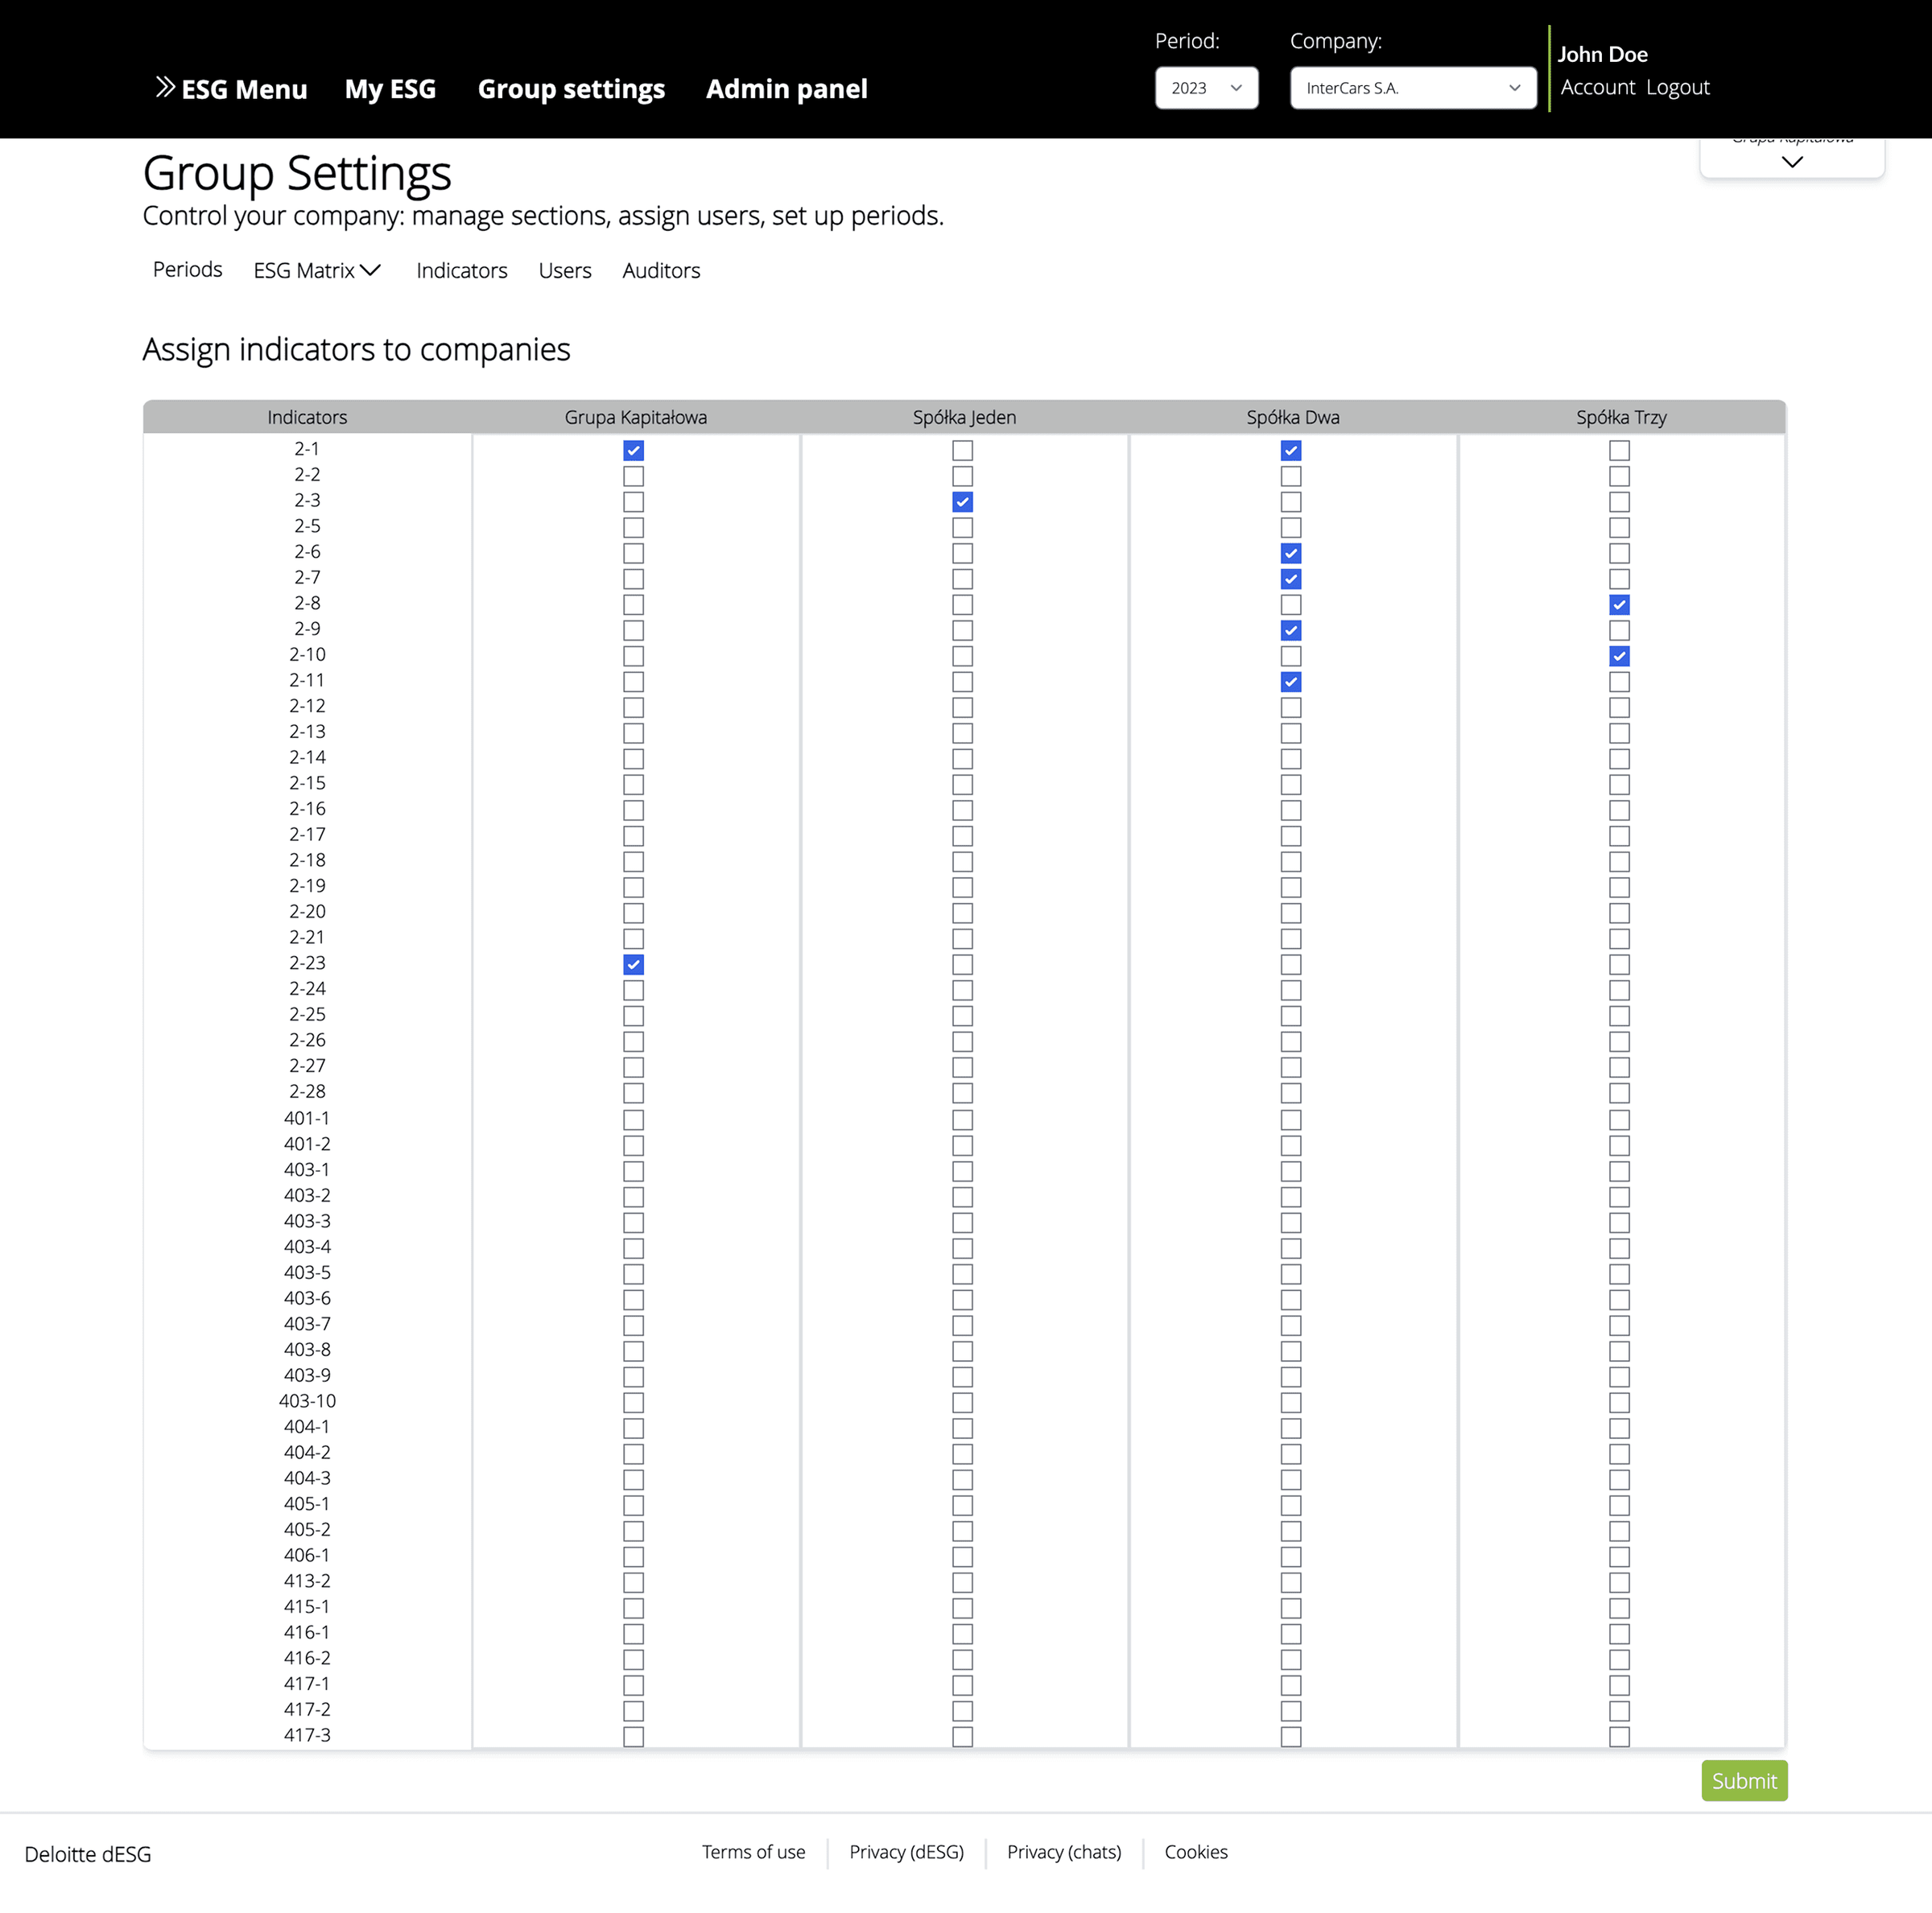
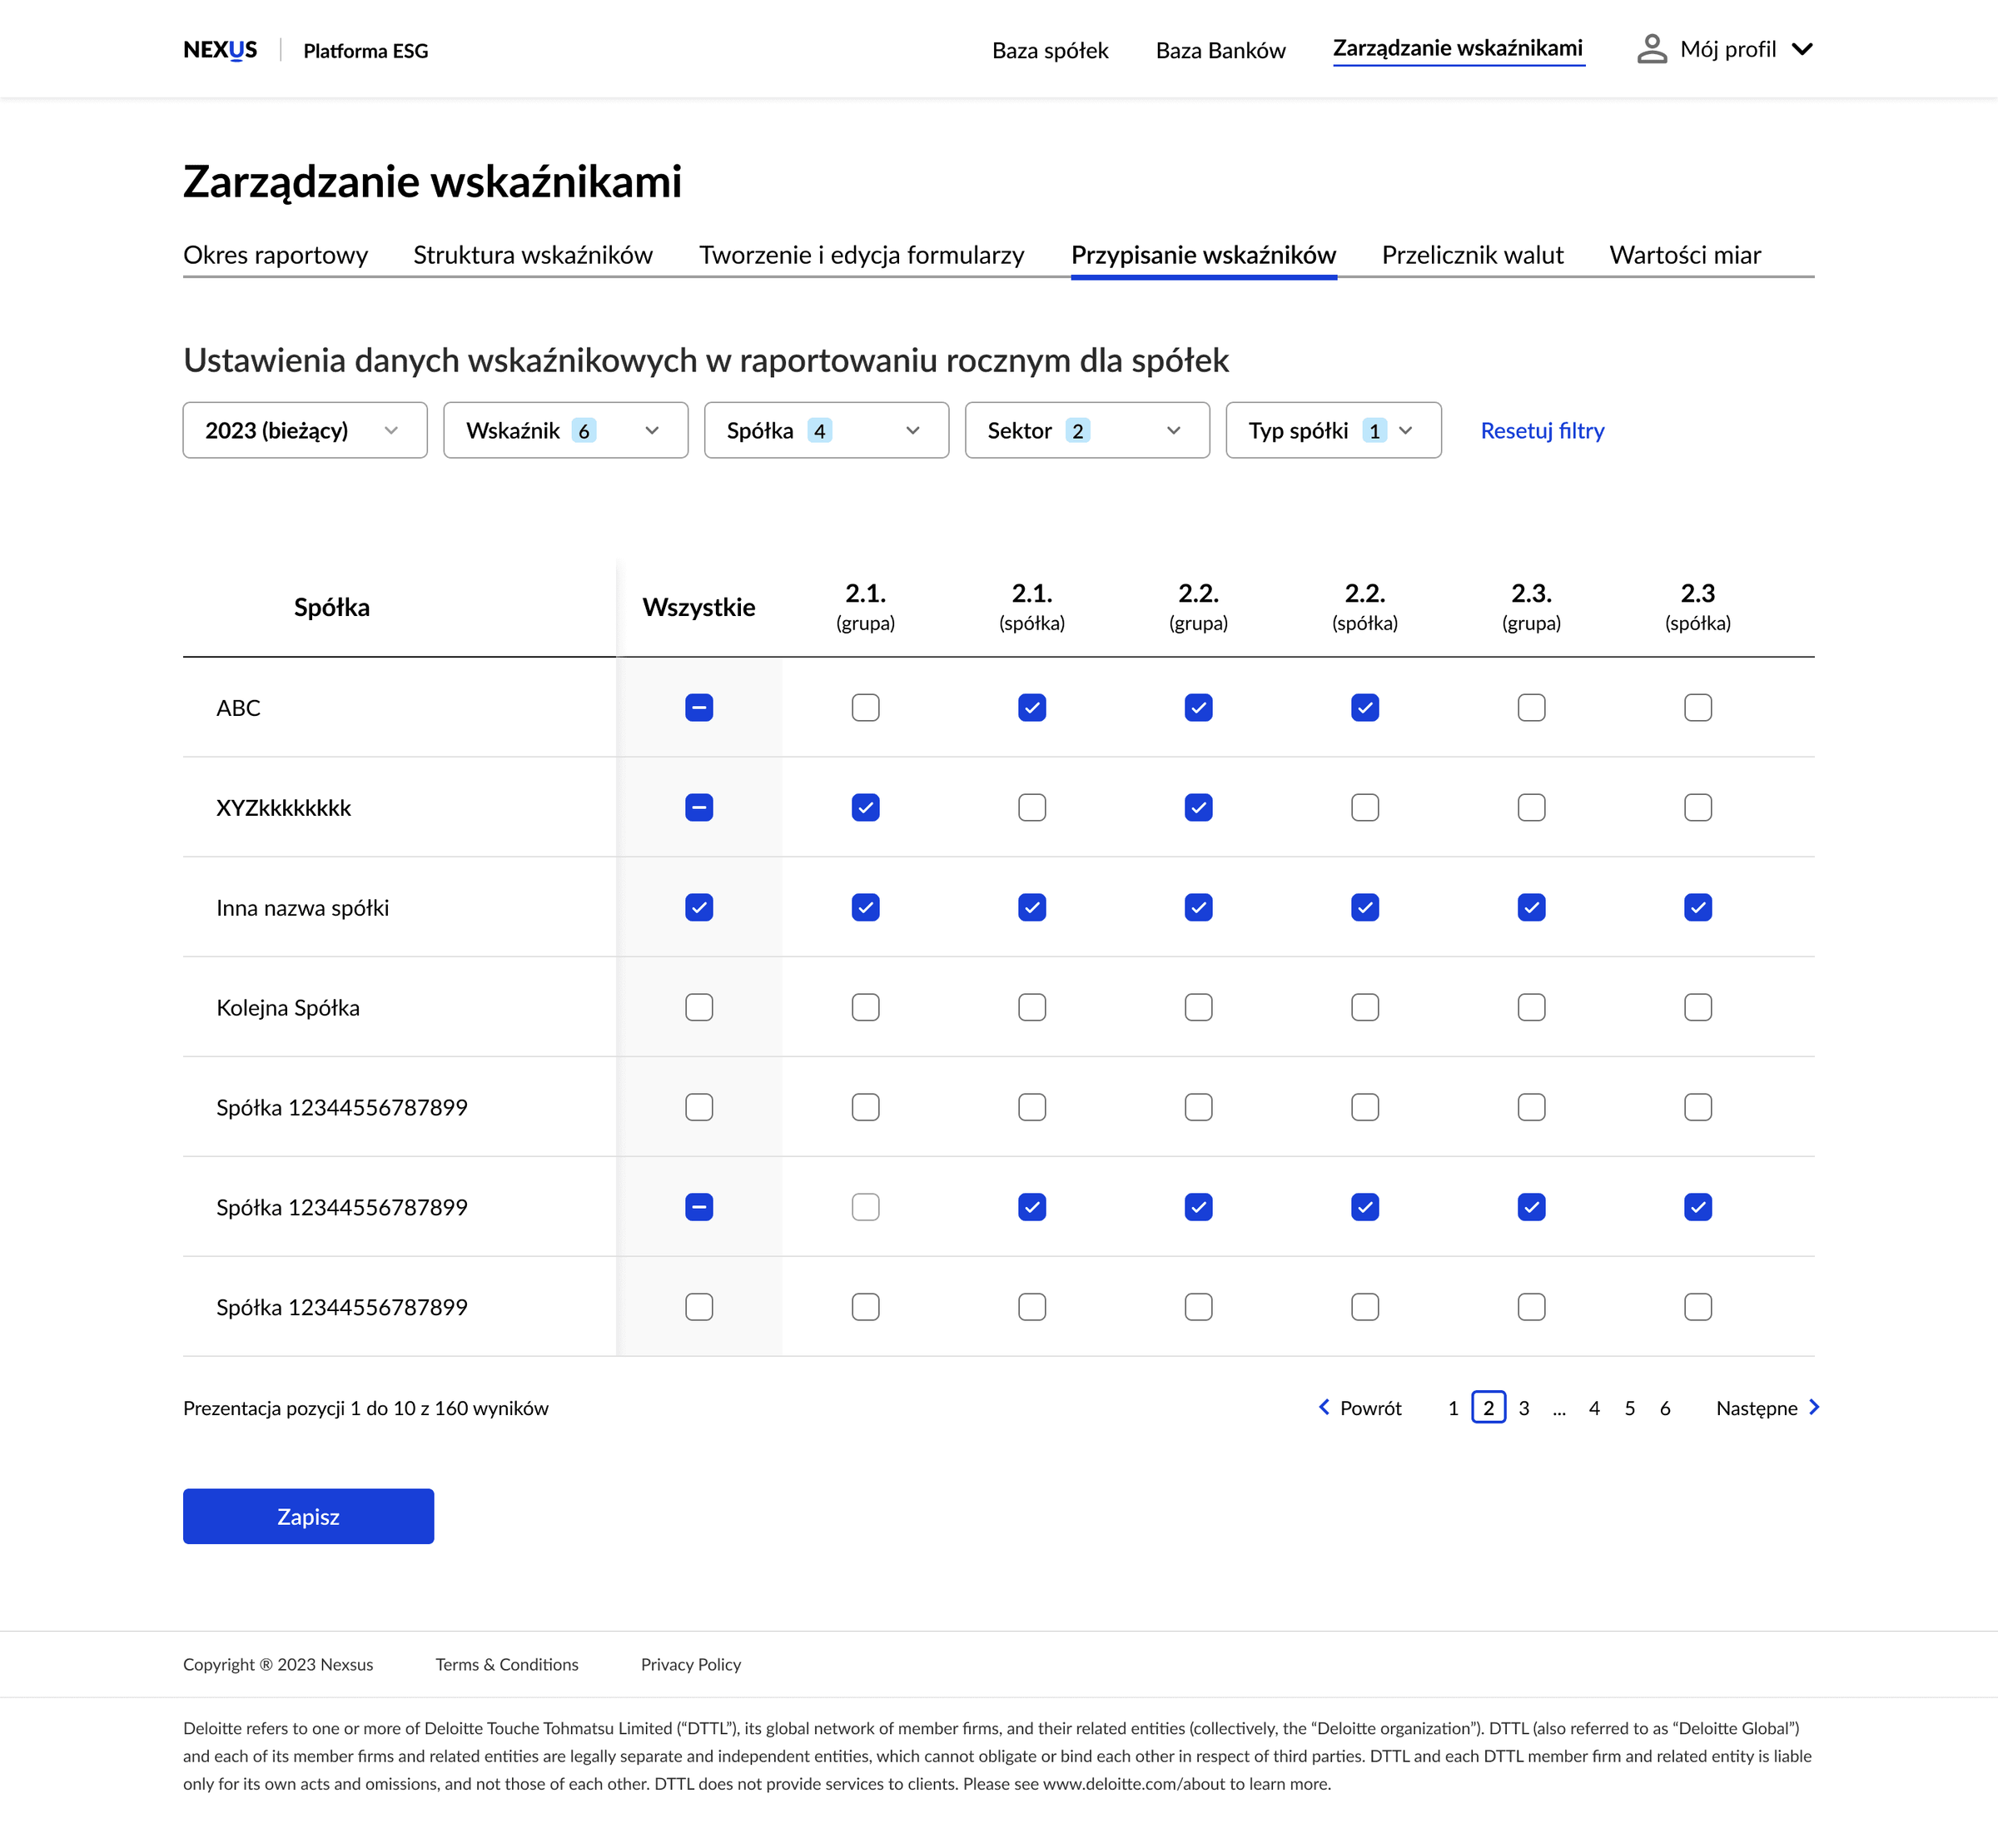
Managing indicators is one of the admin’s core responsibilities, but assigning indicators to companies used to happen in a bulky, unintuitive table. To streamline this, I redesigned the matrix table and introduced smart filters, making it easier to navigate, search and manage assignments.
Outcome
Strong interest across the banking sector
The project has generated significant attention across the banking sector, signalling its strong growth potential and underscoring its crucial role in enabling secure ESG data exchange.
- Financial sector organisations have joined since the launch of the ESG Platform
- 17
- Entities in the database are under qualitative review, with more banks finalising access
- 165